|
Charts
IMPORTANT: Chart buy/sell signals are helpful in determining market support and resistance levels...and probable turning points. However, they are only useful if the analyst has a handle on the larger trend. Experience and judgment play a vital role in that determination ...as does Elliott wave analysis.
If a chart does not not appear when you click on the link, you may need to (1) enable javascript, and/or (2) disable pop up blocking for this site, or (3) right click on your mouse and open the link in a new tab or window. Charts will generally appear when you use Internet Exploer or Firefox. Do not use Google Chrome to view charts.
Contact us at info@wavechart.com if you have a question or comment. |
|

Elliott Wave Chart Blog December 2011 Archive
| December 30, 2011 update...The year 2011 ends with quite a mixed picture in the markets, i.e., some indices were up for the year, some down, some virtually unchanged (see S&P 500). For the final week of the year, the averages were down 1/2 percent or so. Heading into the new year, shorter term cycles point downward. The longer term wave count also points downward. But, the pattern over the coming days (and even weeks) can vary in the way the next phase of the long term decline is set up. Enjoy the new year celebrations...hopefully the near term Elliott wave pattern will become clearer next week. |
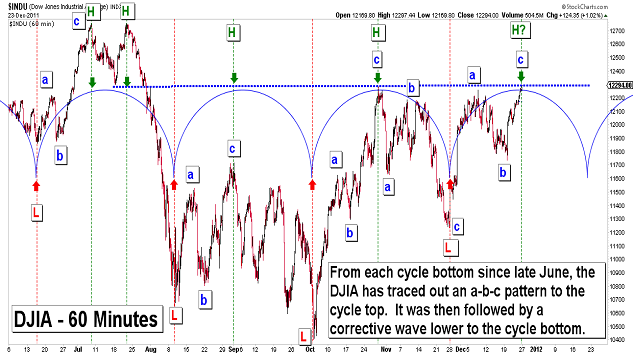
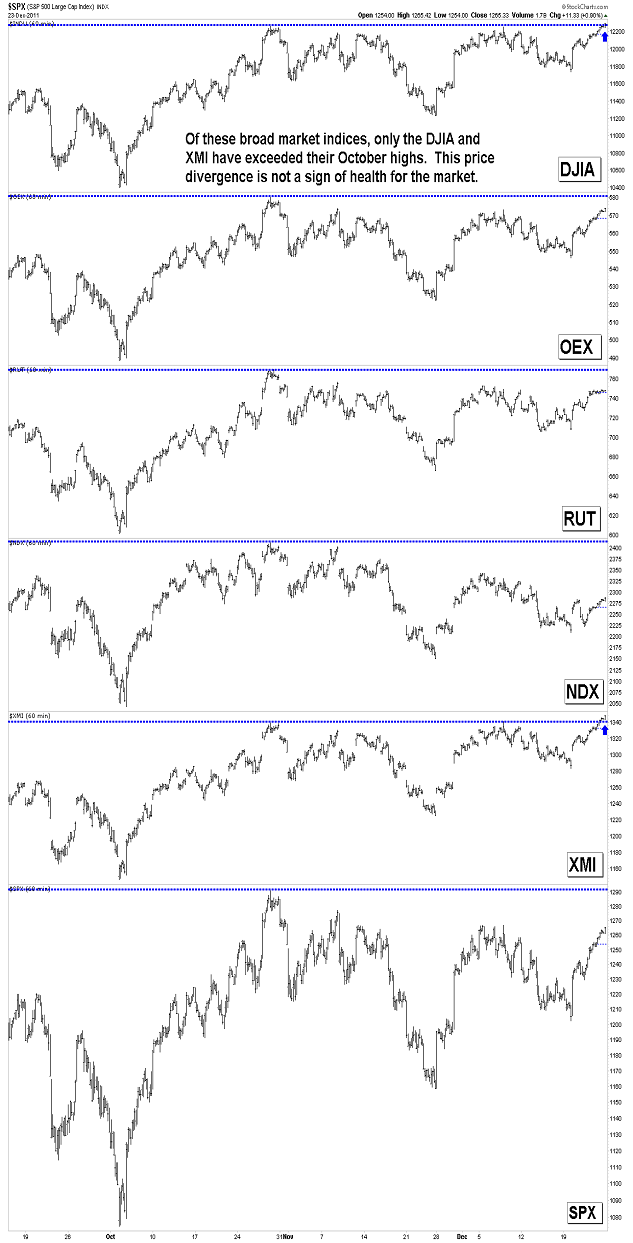
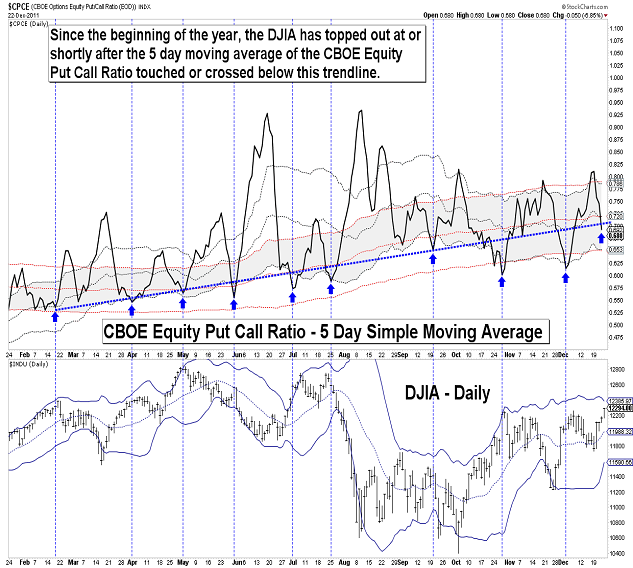
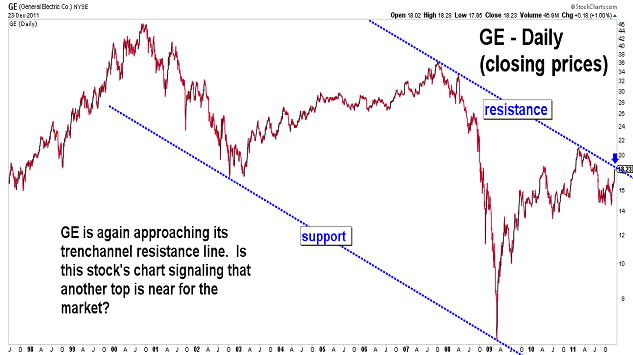
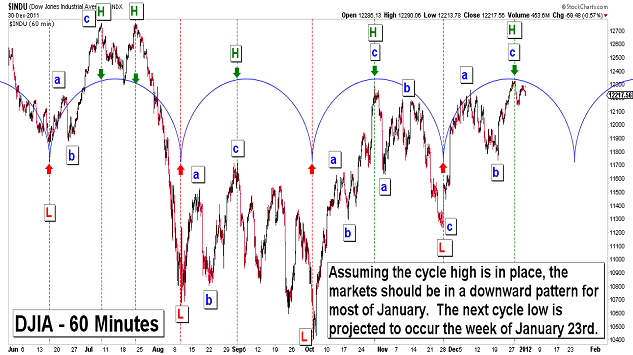
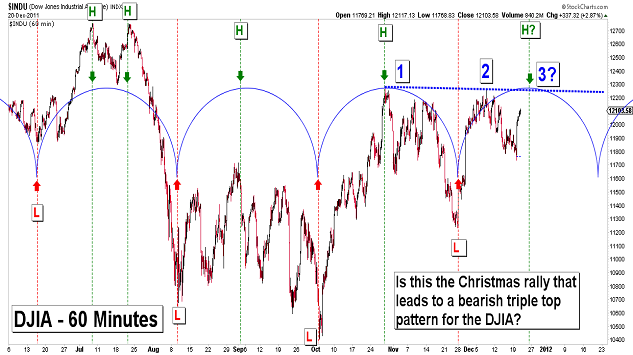
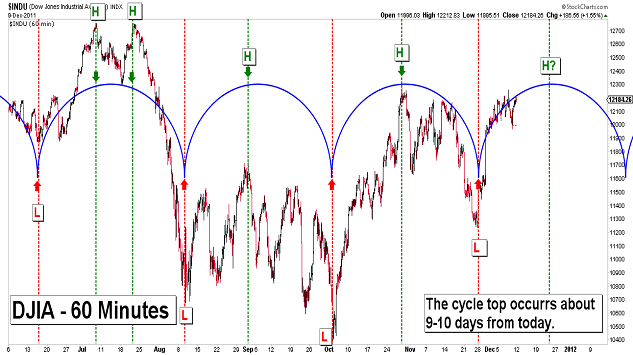
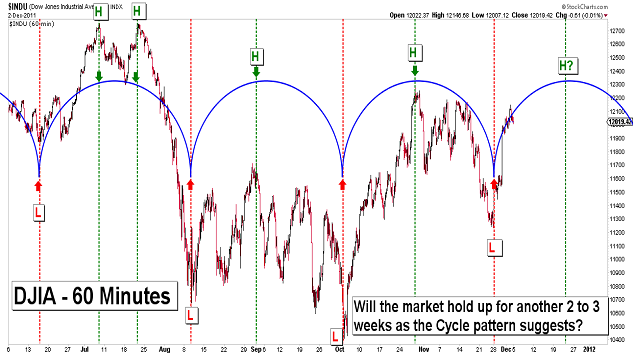
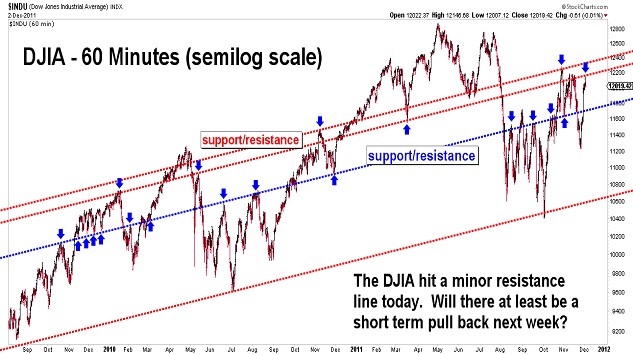
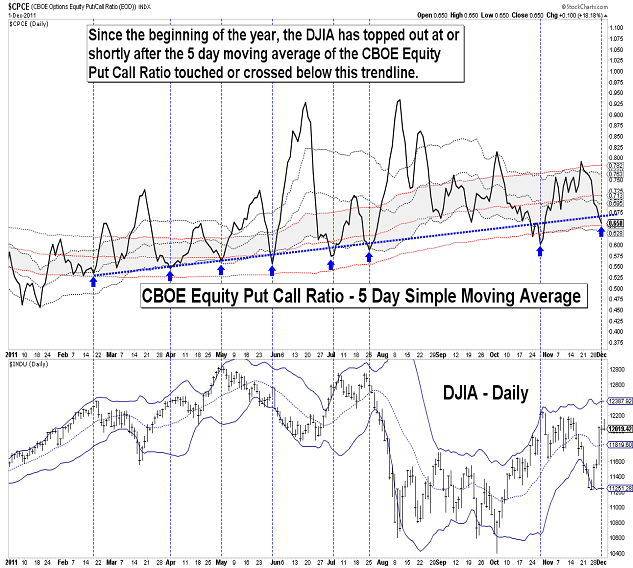
| December 23, 2011 update...The Christmas rally should be nearing its terminal point. Why? (1) A cycle top has been reached (or is near) (see first chart above). (2) Price divergences are now occuring among the broad indices (see second chart above). (3) The market has reached a short term overbought condition. (4) Put Call ratios are once again reaching an area associated with tops (see third chart above). Given that today's high in the DJIA exceeded the October high, it is not a certainty that the next decline will be a third wave below the October lows. The pattern from the May high allows for the possible continuation of the current "second" (or"b") wave pattern...through one more down/up cycle, i.e., an a-b-c pattern to the downside followed by a final a-b-c rally. We'll see. In the meantime, have a joyous holiday this weekend. I'll post one update at the end of next week. |
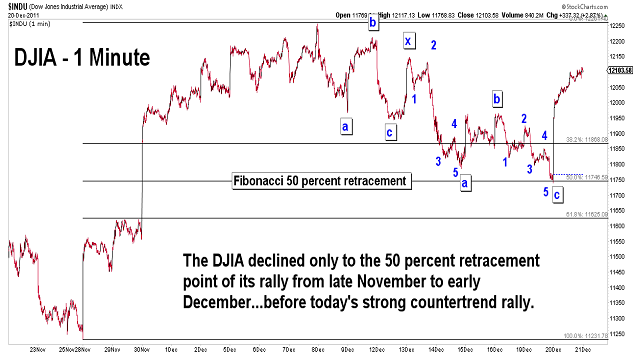
| December 20, 2011 update...Just a short update tonight of the charts that were posted on Friday. Yesterday's decline only took the DJIA to the 50 percent retracement point of the previous rally. Today's reversal and powerful rally appears to be the expected "Christmas rally" that leads to a final triple top pattern for the market. |
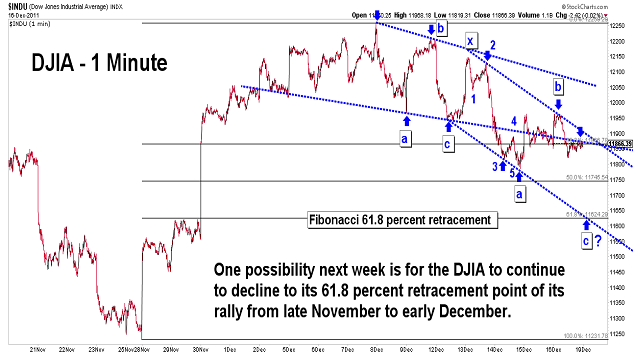
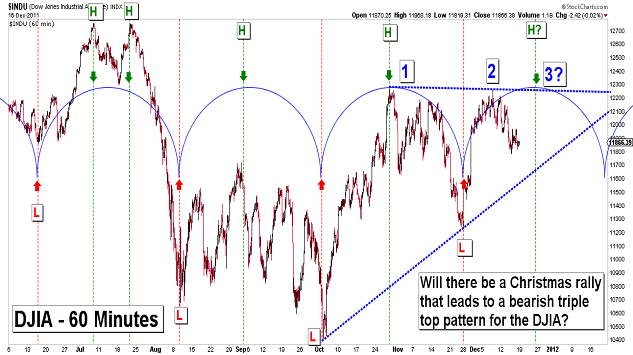
| December 16, 2011 update...I speculated a week and a half ago that the market might decline to the Fibonacci 61.8 percent retracement point of its late November to early December rally. One more decline next week could do the trick. If some type of Christmas rally then follows, we could see the makings of a triple top pattern...setting up the final high (which is likely to be lower than the December 7th high) before a dramatic 3rd wave collapse below the October lows. Of course, a double top is already in place, so the "collapse" may already be underway. We'll see. |
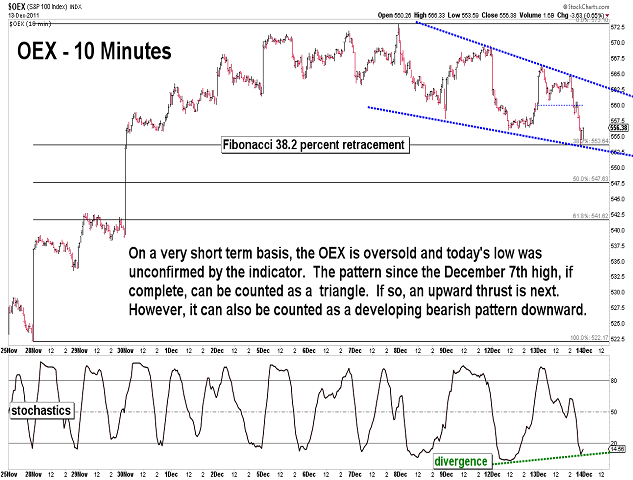
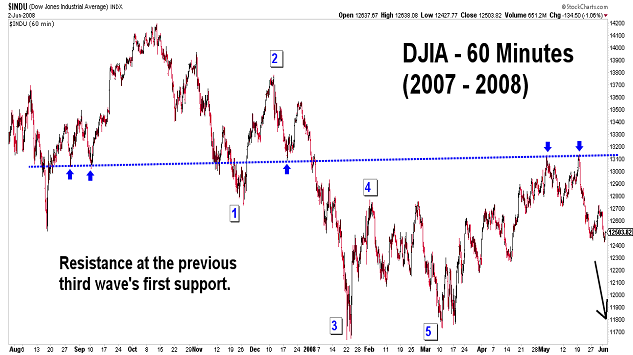
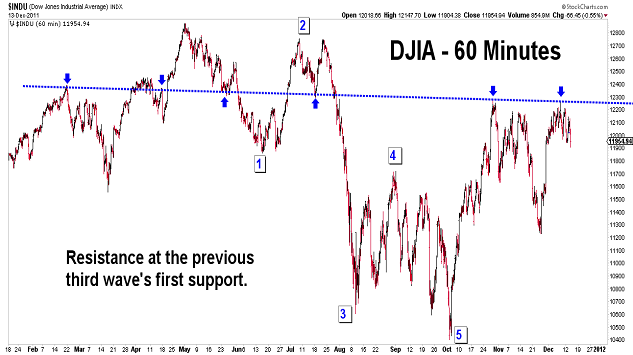
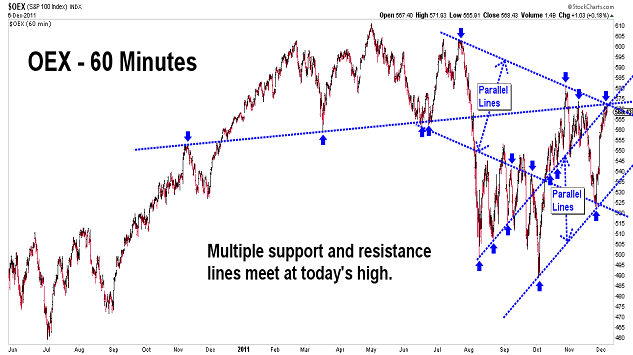
| December 13, 2011 update...The very short term wave pattern, as illustrated by the OEX, allows the market to makes its next move in either direction. If it is upward, it is likely to be the final thrust before a major 3rd wave reversal downward. The other possibility is that a 3rd wave decline has already begun with a leading diagonal pattern. Note the similarity between the current pattern (and support and resistance points) from the May 2011 high and the DJIA's pattern after the high in October 2007. Will the outcome be the same? |
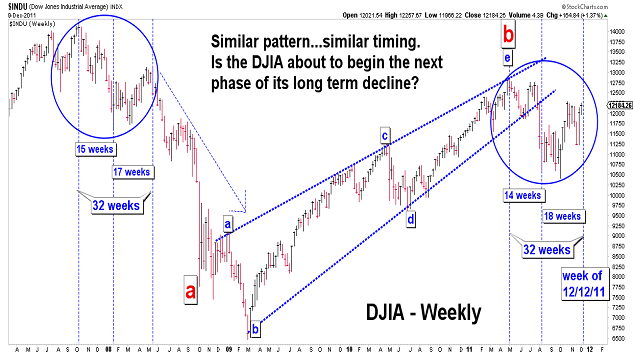
| December 9, 2011 update...The DJIA enters a critical window of time during the next two weeks. The DJIA's pattern and timing since the May 2011 high bears an amazing similarity to the pattern and timing of the decline that began in October 2007. If the DJIA is still following the 2007-2008 pattern, the next phase of the DJIA's long term decline is about to begin and will bring about a dramtic increase in the rate of the DJIA's decline in the months to come. My confidence in the pattern will remain strong as long as the DJIA does not exceed its October high. |
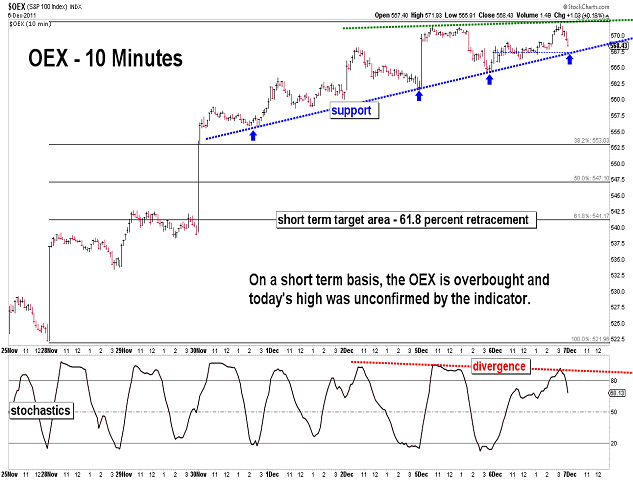
| December 6, 2011 update...Technically, we should be, at the very least, near a short term top. And, if it is only short term, a 61.8 percent retracement of the gains of the past week and a half would be a likely outcome. For the moment, the (still rising) cycle situation is holding me back from expecting more. We'll see. |
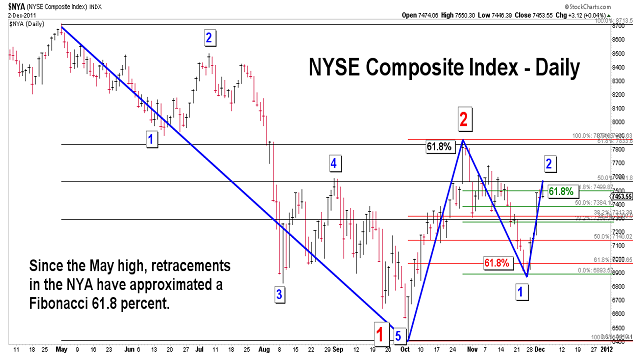
| December 2, 2011 update...This week's powerful rally allowed the market to reach my target and then surpass it with greater speed than I expected. Nevertheless, the pattern for the market that I have discussed in recent updates is still essentially intact. As long as the late October high is not surpassed, the fact that the DJIA exceeded the 61.8 percent retracement point of the November decline is not a major issue (see the NYSE Composite chart). Technically and cyclically, the market has the ability to do what it did at the July and October peaks, i.e. decline and then retrace most of that decline. After that, the dramatic part of a 3rd wave decline should unfold that will break the October lows. I enjoyed playing the long side during this week's rally, but, in the coming weeks, I intend to position myself on the short side of any strong rally. |
Important: Information and chart access provided herein is limited to current subscribers only and shall not be forwarded or retransmitted without written authorization. It is educational in nature and shall not, directly or indirectly, be construed as investment advice. No guarantees are made with respect to the accuracy of the information, opinions, predictions,etc. offered here in. The username/password provided to a subscriber is unique and it is the sole responsibility of the subscriber to protect the confidentiality of said username/password and to further protect it from any unauthorized use.
Copyright © 1997 - 2013. The Elliott Wave Chart Blog. All rights reserved. Email
|